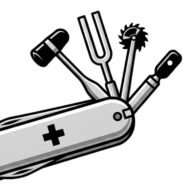

Reiber Diagram: Interpretable in 90 seconds The Reiber Diagram distinguishes between intrathecal synthesis of immunoglobulins (IgG, IgA, IgM) and passive filtration due to dysfunction of the blood-brain barrier (BBB) in the CSF. Basis of the analysis Two ratios are evaluated: QAlb = [CSF_Albumin] / [Serum_Albumin] → Indicator of BBB integrity. QIgG = [IgG_LCR] …
Category archives: Neuroinflammatory
Myelin in the CNS and PNS.

Comparison of myelin: CNS vs. SNP Myelin is a lipid envelope that insulates axons to speed up nerve conduction. Its structure and producing cells vary between CNS and PNS. Origin and composition CNS: Production by oligodendrocytes. A single cell can myelinate up to 50 axons. SNP: Production by Schwann cells. Every cell…
Pediatric myelin oligodendrocyte glycoprotein antibody-associated encephalomyelitis (anti-MOG).
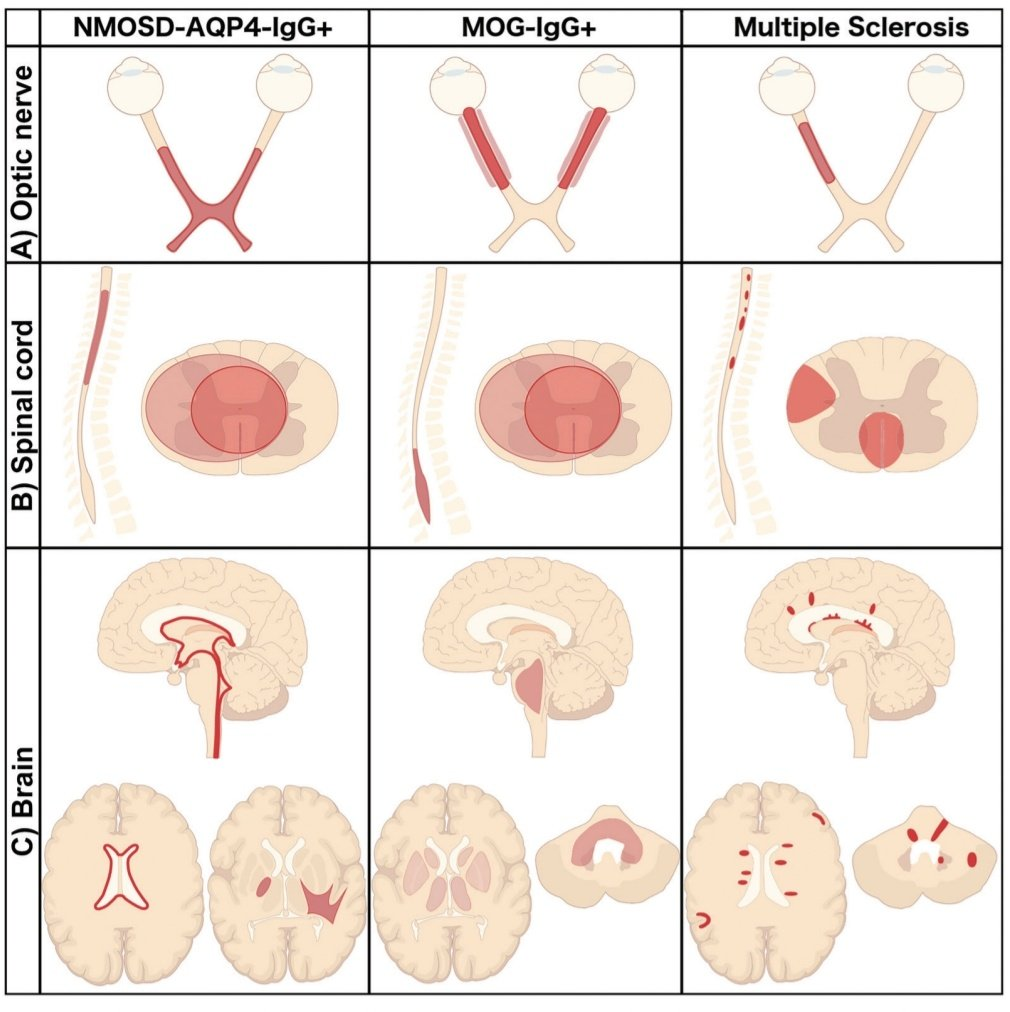
https://pubs.rsna.org/doi/full/10.1148/rg.2020200032